According to the “Observatoire des villes du transport gratuit“, around 40 local authorities have already opted for total free travel in their transport network in France.
Free transport: how to know the number of passengers?
In the context of this free of charge system, the information on ridership from the ticketing system becomes unusable. Automatic passenger counting then becomes the only source of information to know the frequentation and the load of the network. The installation of a counting system is therefore recommended. This must be as efficient and accurate as possible!
Click here to see our article on free transport
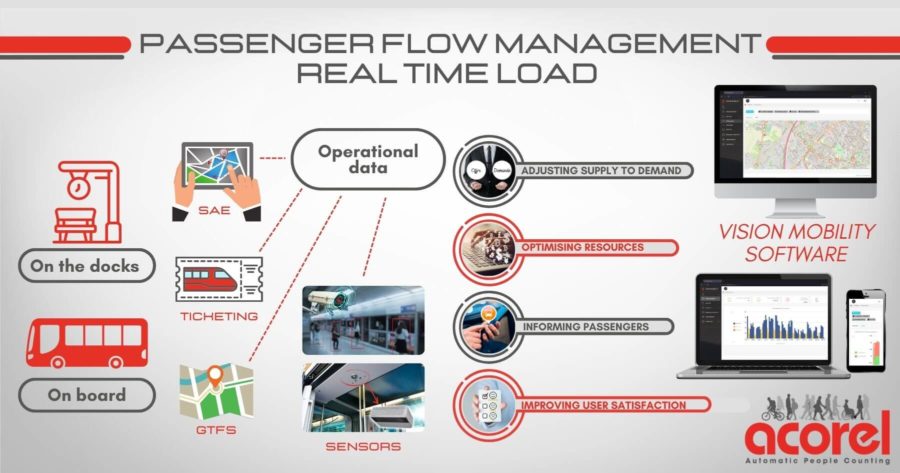
Transport authorities need accurate data on passenger flows for several reasons:
Plan and manage their network:
The number of passengers using buses and trams, the most frequented timetables and the most used routes are crucial data to adapt the transport offer to the demand
Decision making: Metering data will help characterise demand for optimising transport plans and investments for vehicle fleet evolution
Optimise resources:
Thanks to the data collected, the operator will be able to better adjust his human and material resources at both the operational and maintenance levels

VISION-Mobility software suite
All this data collected by Acorel sensors with an accuracy rate of over 99% is then processed in the 𝙑𝙄𝙎𝙄𝙊𝙉-Mobility software suite where algorithms will even allow for self-calibration of the load data
vehicle to optimise their reliability.
A software suite is an essential complement to any automatic passenger counting solution to analyse the data collected by high precision sensors.
This software will allow transport operators to perform an analysis of their network thanks to the collected frequentation data. Thanks to this analysis, an optimization of their transport offer is then possible by adapting their transport offer to the demand and by continuously improving the quality of service.
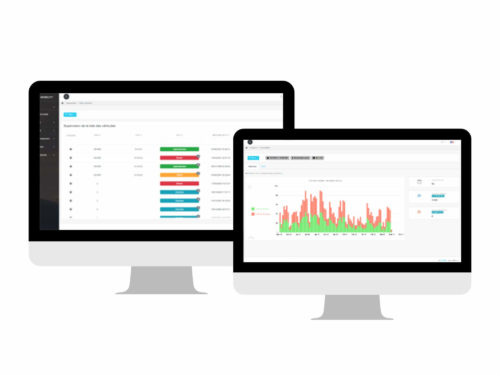
Among the different modules of the software suite, we offer the measurement of the frequentation and the load rate in real time or in historical data, the extrapolation of the data, as well as the complete supervision of the fleet (equipment service rate and sensor status).

Data extrapolation
VISION-Mobility allows the vehicle count data to be reconciled with the city’s reference system and transport plan in order to present count data by line, route and stop.
The VISION-Mobility count data extrapolation module will then make it possible to project count data from “non-counter” vehicles from a history of count data from “counter” vehicles (equipped with a passenger counting system).
The data extrapolation is done automatically and on a daily basis, so no user intervention is required.
This feature can also be very useful during the installation phases. Indeed, Acorel organizes the installation of its metering solution in phases, allowing a homogeneous coverage of the network and thus a quality extrapolation from the first weeks/months of installation.

Supervision and maintenance
Vehicle fleet supervision
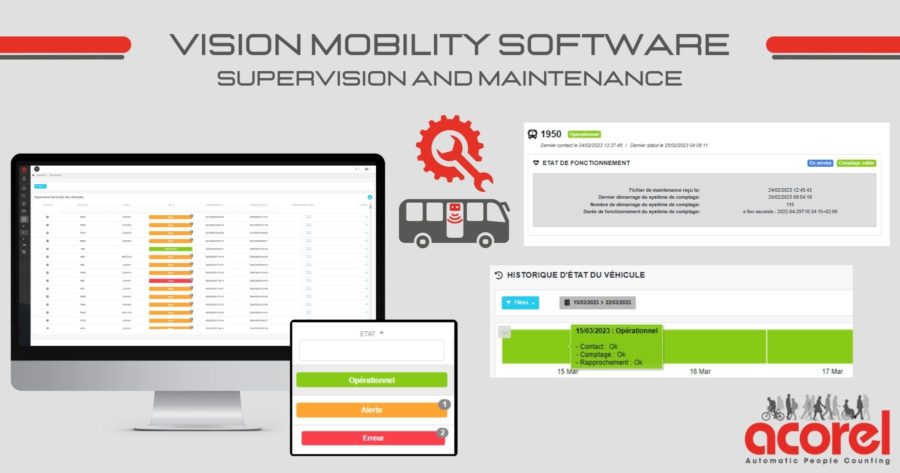
VISION-Mobility allows the operator to have a synthetic visualization of the state of the fleet of vehicles and their rate of availability by automatically issuing alerts if errors on the vehicles are detected.
Vehicle maintenance status screens give the technician the ability to monitor the various technical information, operating status and history of technical maintenance events of the various equipped vehicles by refining the search through period or status filters.
Central system supervision
The central system supervision view presents a summary of the health of each of the application’s services. When loading this view, the services are sorted by type. The default services to be prioritised will therefore be visible first. It is also possible to export the central system maintenance sheet.

