18 Aug 2026

Public transport fare evasion : the fraud rate you’re measuring is probably wrong ?

A global benchmark on transit fare evasion, and the five things that actually reduce it.

Public transport fare evasion : the fraud rate you’re measuring is probably wrong ?

Every transit network with a farebox has a fare evasion problem. Almost none of them can say, with real confidence, how big it actually is. That’s the uncomfortable starting point of a recent Acorel expert panel, “Solutions pour réduire la fraude dans les transports publics,” where independent fare-policy analyst Véronique AMOURETTE and Acorel’s own Vanessa KARABETIAN walked through why the fraud figures most authorities report are structurally unreliable, and what a handful of operators worldwide are doing instead.

We cross-checked that conversation against public audits, transit-authority disclosures, and technology pilots from six countries. The result is a 14-page benchmark report, The Global Transit Fraud Benchmark, free to download at the bottom of this article. Here’s the short version.
Why your national average is hiding the real story

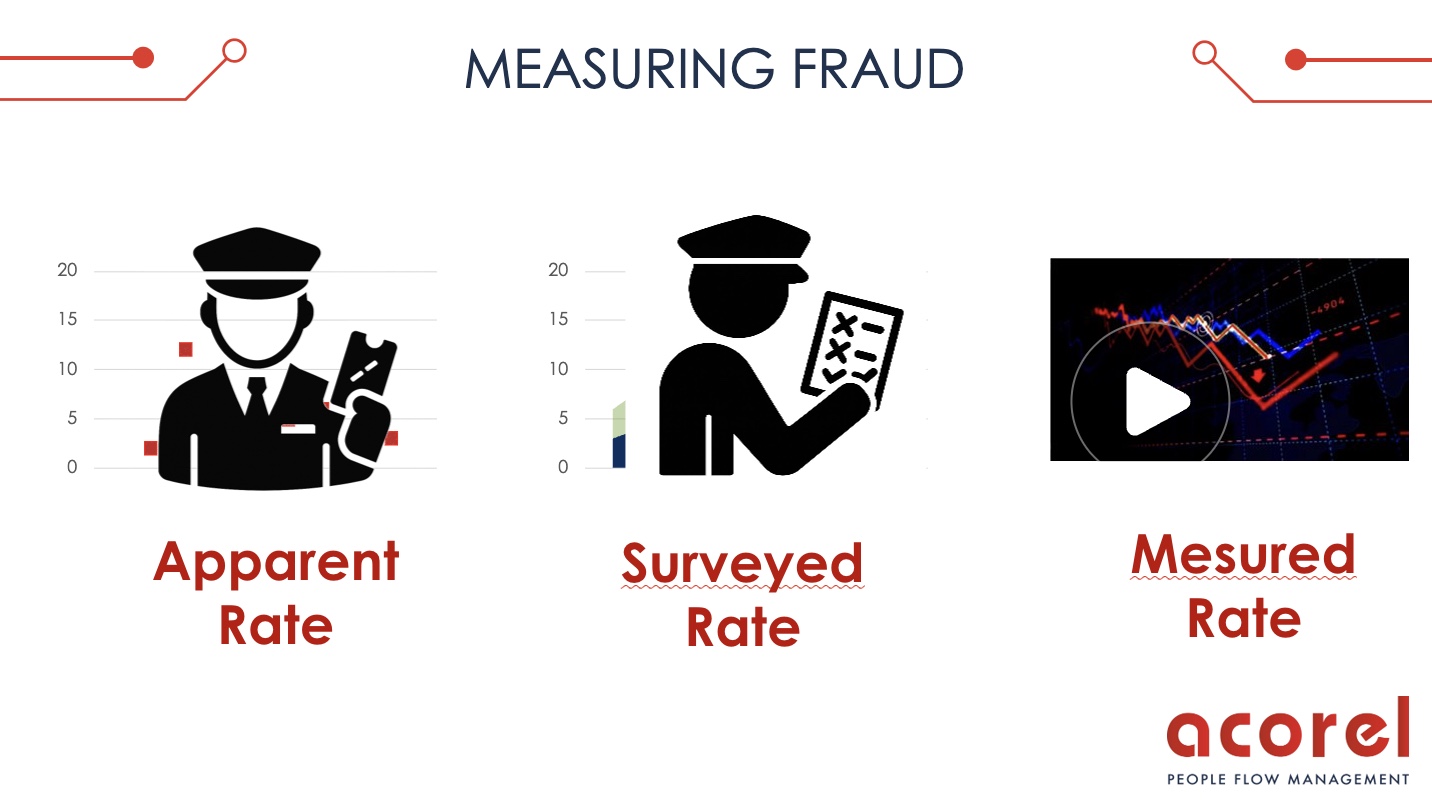
Ask most transit authorities for their fraud rate and you’ll get one number. That number is usually built from one of three very different methodologies, and only one of them is trustworthy:

Apparent rate: what inspectors catch during manual checks. It reflects where and when controllers were sent, not the actual scale of the problem. Board a peak-hour bus in an affluent suburb and the numbers look clean; check a night tram line and they spike.

Surveyed rate: self-reported data from short field campaigns, typically run for a single week. It’s declarative and out of date the moment the school calendar changes.

Measured rate: a continuous, automated cross-reference between passenger counts and ticket validations. It’s the only version that’s objective, granular by line and time slot, and current in real time.

In France, the difference matters enormously: the national average sits at 8 to 10%, but that figure hides a ten-fold spread. Some southern urban networks report evasion above 20%, and specific suburban or night lines run as high as 60%. A single average tells an authority nothing about where to act.

Why your national average is hiding the real story

The scale of the problem, verified

France’s fare evasion costs an estimated €700 million a year, the equivalent of 1,500 new buses, with three-quarters of that loss concentrated in the Île-de-France region alone. The same pattern of a deceptively calm average sitting on top of a volatile reality shows up everywhere we checked:

New York (MTA): roughly $1 billion lost to fare and toll evasion in 2024, with subway evasion falling from 14% to 10% and bus evasion from 50% to 45% in just six months once the agency started measuring continuously (CBC / MTA Blue-Ribbon Panel).

Toronto (TTC): $123.8 million lost in 2023, with a weighted evasion rate of 11.9% masking a huge gap between streetcars (29.6%) and subway stations (6.3%) (TTC 2023 Fare Evasion Study).

San Francisco (BART): an independent 2025 audit found the agency’s own $25 million loss estimate was likely inflated. The real figure is closer to $5.7 to 9.5 million, while enforcement costs far exceeded what it recovered (Center for Policing Equity).

Melbourne and Singapore: the Victorian Auditor-General found network-wide evasion at 13.5% in Melbourne (full report), while Singapore’s Public Transport Council logged 7,618 fare-cheating cases in FY2017: 62% simple non-payment, 26% underpayment, 12% concession-card misuse (Torque).

Across the five USD-reporting networks above, reported annual losses add up to more than $1.2 billion, plus a further £130 to 190 million a year in London, and in half of these cases, the agency’s own headline figure was later revised or disputed once independently broken down by mode.

Five reasons people don't pay, and why blanket enforcement misses most of them

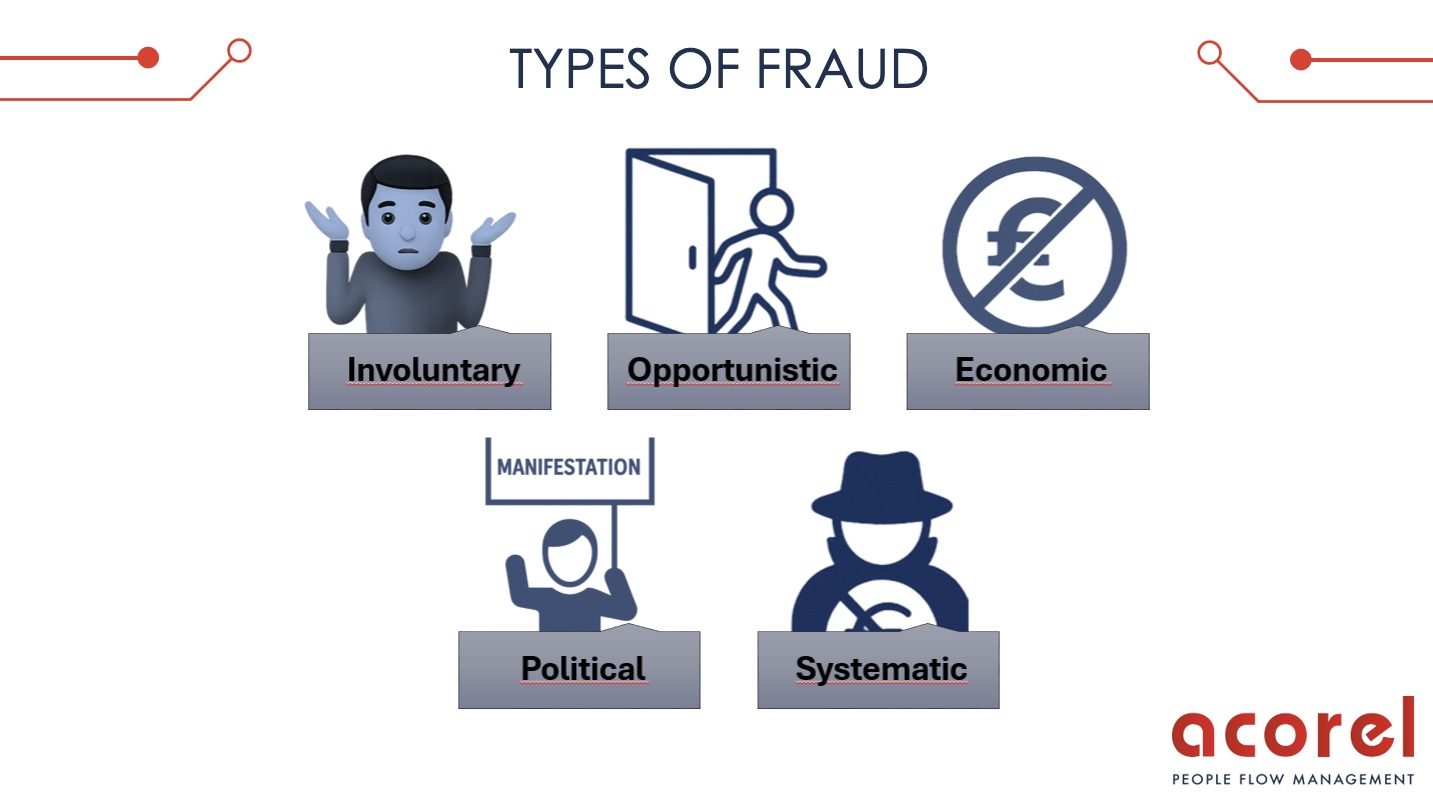
Véronique Amourette’s typology, presented during the webinar, is a useful corrective to one-size-fits-all enforcement. Riders who don’t pay generally fall into five groups: the involuntary (blocked by a broken machine or a forgotten card), the opportunistic (who calculate the odds of inspection), the economic (choosing between a ticket and another essential cost), the political (refusing to pay as protest), and the systematic, the smallest group, but the costliest.

Treating all five the same way doesn’t just waste resources: audits suggest it can actively misfire. The Center for Policing Equity’s BART review found civil citations were paid at a rate of only 6 to 12%, while 43.5% of people stopped on suspicion of fare evasion were Black riders, a concentration the report calls disproportionate to ridership. A separate 2024 academic analysis of New York City subway enforcement found no statistically significant link between fare-evasion arrests and reductions in surrounding crime. Manual, blanket enforcement doesn’t reliably find the profile that’s actually costing the network the most.

Five reasons people don't pay, and why blanket enforcement misses most of them

"Just make it free" doesn't solve the measurement problem

High fraud rates push some local politicians toward a simple-sounding fix: eliminate the fare entirely. France’s Court of Auditors examined the evidence and reached a more cautious conclusion: fully free networks don’t trigger a major shift away from private cars. Instead, they generate short, marginal trips from people who’d otherwise have walked, while raising overcrowding risk on the busiest lines. Free transit is also never actually free: the lost commercial revenue has to be recovered through local taxpayers or a higher transit tax on local employers.

There’s a practical problem hiding inside the policy debate, too: when the ticket disappears, so does the statistical signal transit authorities have always used to plan capacity. We’ve written before about how automatic passenger counting keeps that signal alive on free-fare networks, including how Rio de Janeiro equipped its free-access Olympic tram line with over 500 counting sensors and independently verified 99% accuracy, proving that ridership and attractiveness can still be measured with confidence even after the farebox goes away.

What's actually working, from Barcelona to Grenoble

No single intervention solves fare evasion on its own. Physical “gate hardening,” replacing waist-high turnstiles with tall pneumatic gates, cut BART’s rider-witnessed evasion by more than half within a year (BART fare-gate project). Computer vision layered onto existing CCTV is growing fastest: in Barcelona, rail operator FGC’s AWAAIT-built system cut evasion by more than 70% at one station within weeks, without adding a single new barrier (AWAAIT / FGC case study), and London’s Willesden Green “Smart Station” trial generated 44,000 behavioral alerts on existing Underground cameras while blurring every non-offending face in real time (TfL FOI disclosure). Biometric fare gates, piloted on Santiago’s Metbus network, reached around 98% recognition accuracy (Innovatrics), a real performance gain, but with real data-governance trade-offs that anonymous measurement doesn’t carry.

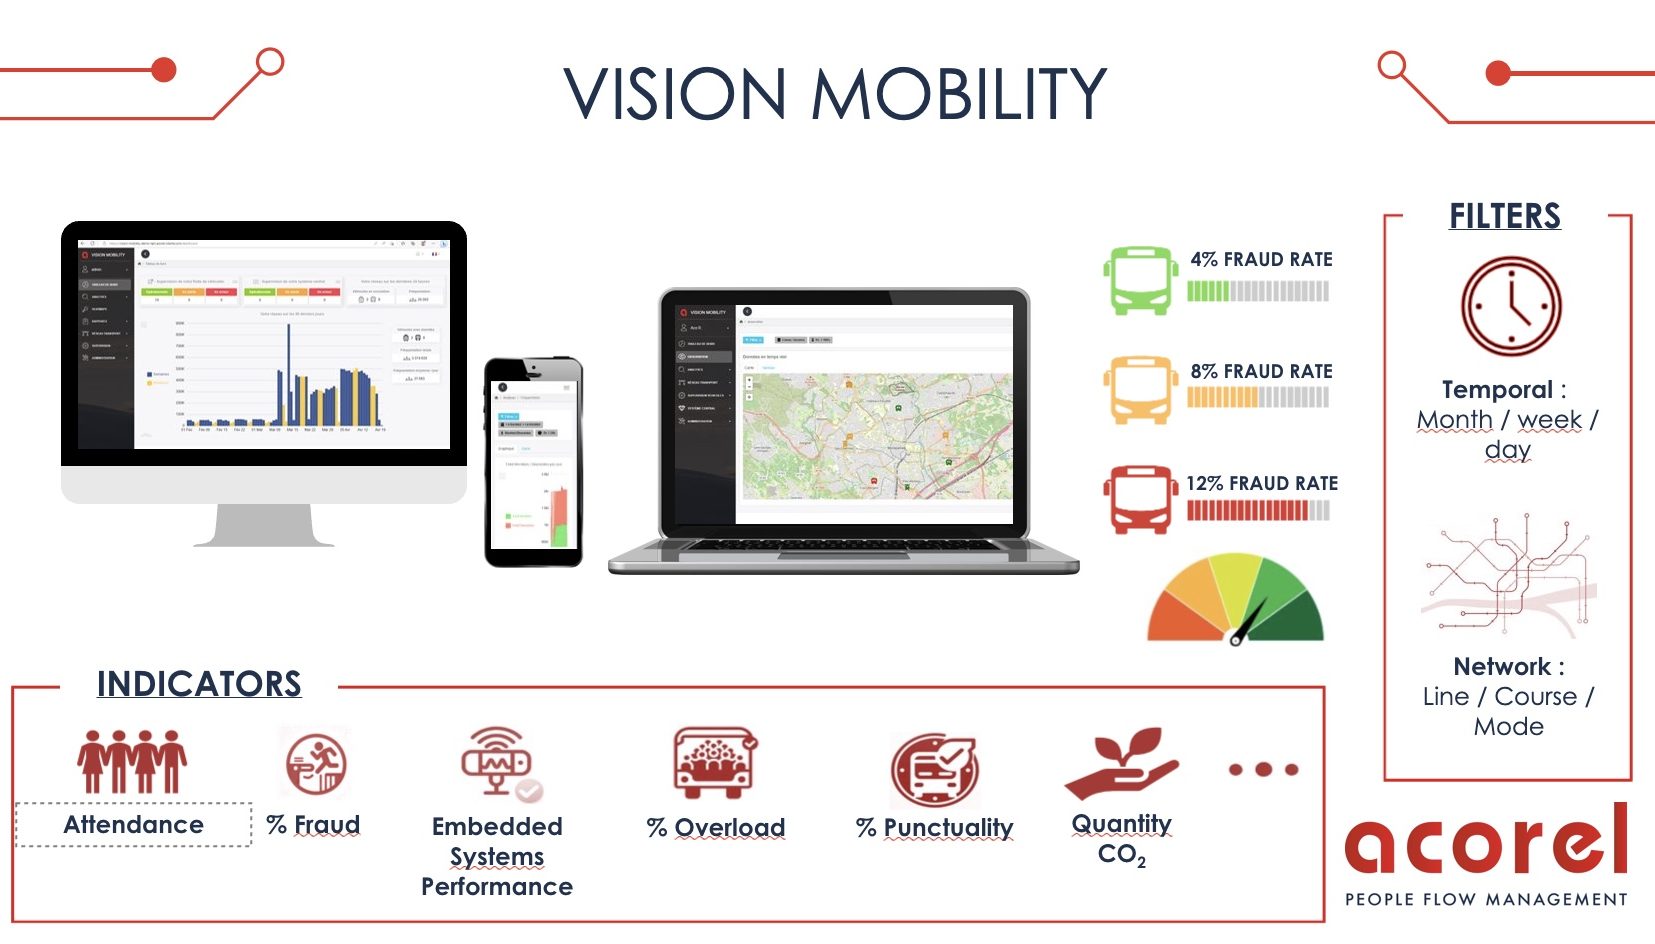
That’s the gap Acorel’s own approach is built for. Our Vision Mobility platform cross-references anonymous, GDPR-compliant passenger head-counts against ticketing validations in real time, with no facial recognition and no personal data stored, flagging exactly which line, stop, and time window needs an inspector right now instead of a random one. It’s the same measurement approach behind two proof points in the full report: Grenoble, where a €1 million annual system secures €45 million in commercial transit revenue, and a 44-station North European metro network where Acorel counting technology maintains 99.2% accuracy across 125.6 million annual passengers.

The same measurement principle applies well beyond fare enforcement. Across urban mobility and rail transport more broadly, continuous passenger flow analysis is what turns a guess about network performance into something an operator can actually act on.

What's actually working, from Barcelona to Grenoble

Want to measure the real fare evasion rate on your network?

Acorel’s Vision Mobility platform cross-references anonymous, GDPR-compliant passenger counts with ticket validations in real time, so you can target inspections where they’re actually effective.

Request a personalized demo of the solution


"Solutions to reduce fare evasion on public transport"

Discover our webinar hosted by Vanessa KARABETIAN and Veronique AMOURETTE

Get the full report

The complete Global Transit Fraud Benchmark report, 14 pages, fully sourced, walks through all six international case studies, the full five-profile fraudster typology, the mechanics of Acorel’s Vision Mobility platform, and a five-point recommendation playbook for transit authorities. Download the PDF or get in touch with our team to talk through what measured fraud data could look like on your own network.

Ready to learn more?

Make an appointment with our sales manager

Free 30-minute consultation

Take an appointment
Commercial team :
Sylvain BERREE

Sylvain BERREE

Sales manager