
28 Jul 2026

Origin/Destination in public transport: principles and applications

Across public transport networks, operators rarely know exactly where passengers board and where they get off. Yet every trip holds key information for transport operators and authorities. Understanding these invisible flows would make it far easier to optimize routes, connections, and mobility services. Origin/Destination (O/D) analysis does exactly that: it identifies these boarding and alighting points to reconstruct passenger journeys across a network.

Acorel offers an Origin/Destination solution built on automatic passenger counting (APC). This article explains how it works, the technologies involved, and the benefits it brings to transport networks.

Origin/Destination in public transport: principles and applications

Origin/Destination in public transport

What is Origin/Destination analysis?

Origin/Destination analysis relies on collecting and analyzing data on where public transport passengers start (origin) and end (destination) their journeys. In practice, it means reconstructing a traveler’s route through a public transport network, from boarding a vehicle to alighting, potentially through several transfers. This data is typically gathered through surveys, electronic sensors, transport tickets, or mobile applications.

The goal is to better understand passengers and track their movements in order to adapt services accordingly. Without a precise understanding of real passenger flows, operators are forced to rely on assumptions or partial data, which limits the relevance of operational decisions. O/D analysis fills this gap by providing an objective, quantified picture of trips across the entire network, line by line and stop by stop.

Data collection and processing

Data for O/D analysis can be collected in several ways. As mentioned above, travel surveys, where users are asked about their trips, remain one of the traditional methods. These surveys, usually conducted through polling or questionnaires, are simple to implement, but they also have limitations: small sample sizes, imprecise self-reported data, and high costs for keeping data updated over time.

For more precise, continuous data, smart cards and location data are now widely used. Smart cards validate trips when passengers enter, and sometimes exit, the network. Location data comes from mobile applications and onboard geolocation systems. Both methods track passenger movements in real time, anonymously and continuously, offering a far more accurate and up-to-date view of actual network ridership than one-off surveys.

Automatic passenger counting sensors for Origin/Destination analysis

Collecting Origin/Destination data requires advanced technology, and automatic passenger counting (APC) sensors are central to the process. They overcome the limitations of self-reported surveys by delivering objective data, automatically measured at every stop, across every line, at any time of day.

What is an automatic passenger counting sensor?

Concretely, counting sensors are devices installed in vehicles or at the access points of stations. They record the entries and exits of people at each passage. There are several types of sensors, such as infrared sensors, counting cameras, or RFID-based systems. 

Infrared sensors are used in buses or trams to count incoming and outgoing passengers at each stop. They operate by detecting interruptions in an infrared light beam caused by the passage of an individual. As for the counting cameras, they use computer vision algorithms to analyze video images and count passengers. 

Acorel supplies these counting sensors, which are designed to be integrated into the various types of vehicles in the network. To find out more, visit our page on urban mobility. 
 

Origin/Destination analysis in practice at Acorel

Having covered the data collection methods and the tools used to analyze them, here is how O/D analysis works at Acorel.

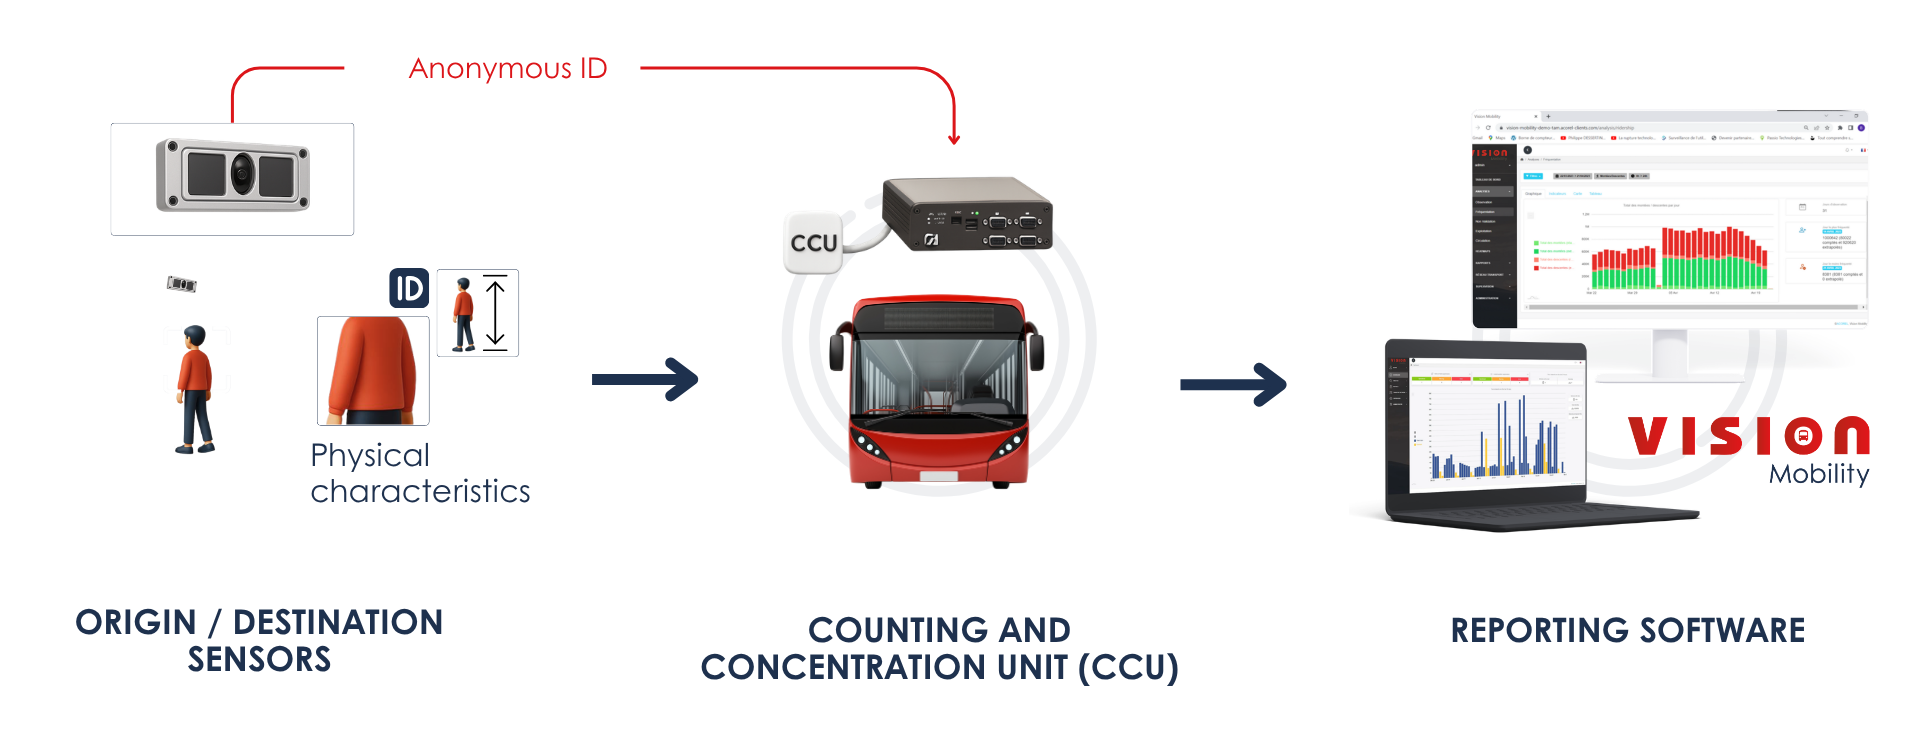
As explained above, automatic passenger counting sensors are installed in vehicles so that boardings and alightings are recorded precisely at every stop. These sensors collect real-time passenger flow data, giving network managers a clear view of vehicle occupancy and passenger flows, allowing them, for example, to immediately spot an overcrowded line or a stop where average wait times exceed expected thresholds.

To enable Origin/Destination analysis, each passenger is assigned an anonymized identifier. This identifier is generated from non-personal physical characteristics, such as clothing color or height. This way, a passenger’s journey can be tracked anonymously from boarding to alighting, in full compliance with GDPR regulations. No biometric or identifying data is retained: only the movement itself, stripped of any personal information, is analyzed.

Data collected by the sensors is then centralized by the counting and concentration unit (CCU), which continuously aggregates information from every vehicle across the network. It is processed and analyzed in Acorel’s Vision Mobility reporting software, which generates detailed passenger flow indicators: Origin/Destination matrices, occupancy rates, load per segment, and ridership by time slot.

Download the Origin/Destination solution sheet

The solution is designed to adapt to different vehicle types, such as buses and trams, and can be rolled out progressively across an entire fleet, line by line, based on each network’s priorities.

Origin/Destination analysis in practice at Acorel

The benefits of Origin/Destination analysis for transport networks

Origin/Destination analysis brings numerous benefits to public transport networks.

Thanks to data from automatic passenger counting and anonymized boarding/alighting identification, travel flows can be understood with far greater precision.

This information makes it possible to match supply with demand by:

  • optimizing schedules, aligning service frequency with actual ridership peaks;
  • adjusting routes based on the areas of highest demand and the most heavily used connections;
  • adapting vehicle capacity on the busiest lines to avoid overcrowding during peak hours.


It also supports:

  • infrastructure planning, by identifying where new stops, depots, or park-and-ride facilities would be most valuable;
  • improved connections between transport modes, by pinpointing the busiest transfer points between bus, tram, metro, or train;
  • more tailored fare policies, based on passengers actual travel habits.


Finally, Origin/Destination data serves as a strategic decision-making tool, enabling operators to respond more effectively to disruptions and improve the overall passenger experience. During roadworks, major events, or network incidents, having up-to-date O/D matrices makes it possible to anticipate traffic shifts to other lines and adjust service accordingly, rather than simply reacting to the disruption.

In conclusion, Origin/Destination analysis provides a deeper understanding of passenger flows across public transport networks. Thanks to Acorel’s automatic passenger counting solution, operators can adapt transport supply, optimize network operations, and improve the passenger experience, all while relying on reliable, continuous, and privacy-compliant data.

Ready to learn more?

Make an appointment with our sales manager

Free 30-minute consultation

Book an appointment
Commercial team :
Sylvain BERREE

Sylvain BERREE

Business Developer