About client
Amusement / Leisure Park
Large-format amusement parks welcome several million visitors per year across a wide range of attractions rides, shows, themed zones, and dining. These are complex, high-footfall environments where visitor satisfaction is directly tied to how efficiently queues and flows are managed throughout the day.
Key operational characteristics
High daily visitor volumes with significant seasonal and intraday variability
Multiple attractions operating simultaneously, each with independent queues
Visitor experience heavily influenced by perceived and actual waiting times
Large operational teams requiring fast, actionable data to make on-ground decisions
A park running on instinct until now
Historically, parks have relied on manual observation, staff estimates, and experience-based intuition to manage visitor flows. While these methods have a place, they cannot provide the speed, accuracy, or scalability needed to optimise a park attracting millions of visitors each year. The need for a structured, data-driven alternative became clear.
The problem
Managing visitor flows at scale presents a genuinely difficult operational challenge. Without objective, real-time data, even well-staffed parks struggle to anticipate and respond to congestion before it impacts the visitor experience.
Core challenges faced by the park
No reliable way to measure queue lengths or waiting times continuously and objectively
Congestion hotspots difficult to identify in advance, leading to reactive rather than proactive management
Resource allocation (staff, ride throughput adjustments) based on estimates rather than live data
Visitors unable to access accurate waiting time information before joining a queue
Limited ability to analyse operational performance over time and measure the impact of changes
The solution
Sensor infrastructure
Acorel deployed stereoscopic 3D cameras combined with Computer Vision technologies at strategic points within each attraction. Unlike simple beam counters or manual checks, these sensors provide continuous, highly accurate people-counting data detecting both entries and exits from queues, measuring queue lengths in real time, and identifying emerging trends in visitor flow patterns across the park.
Centralised data platform / VISION Pop
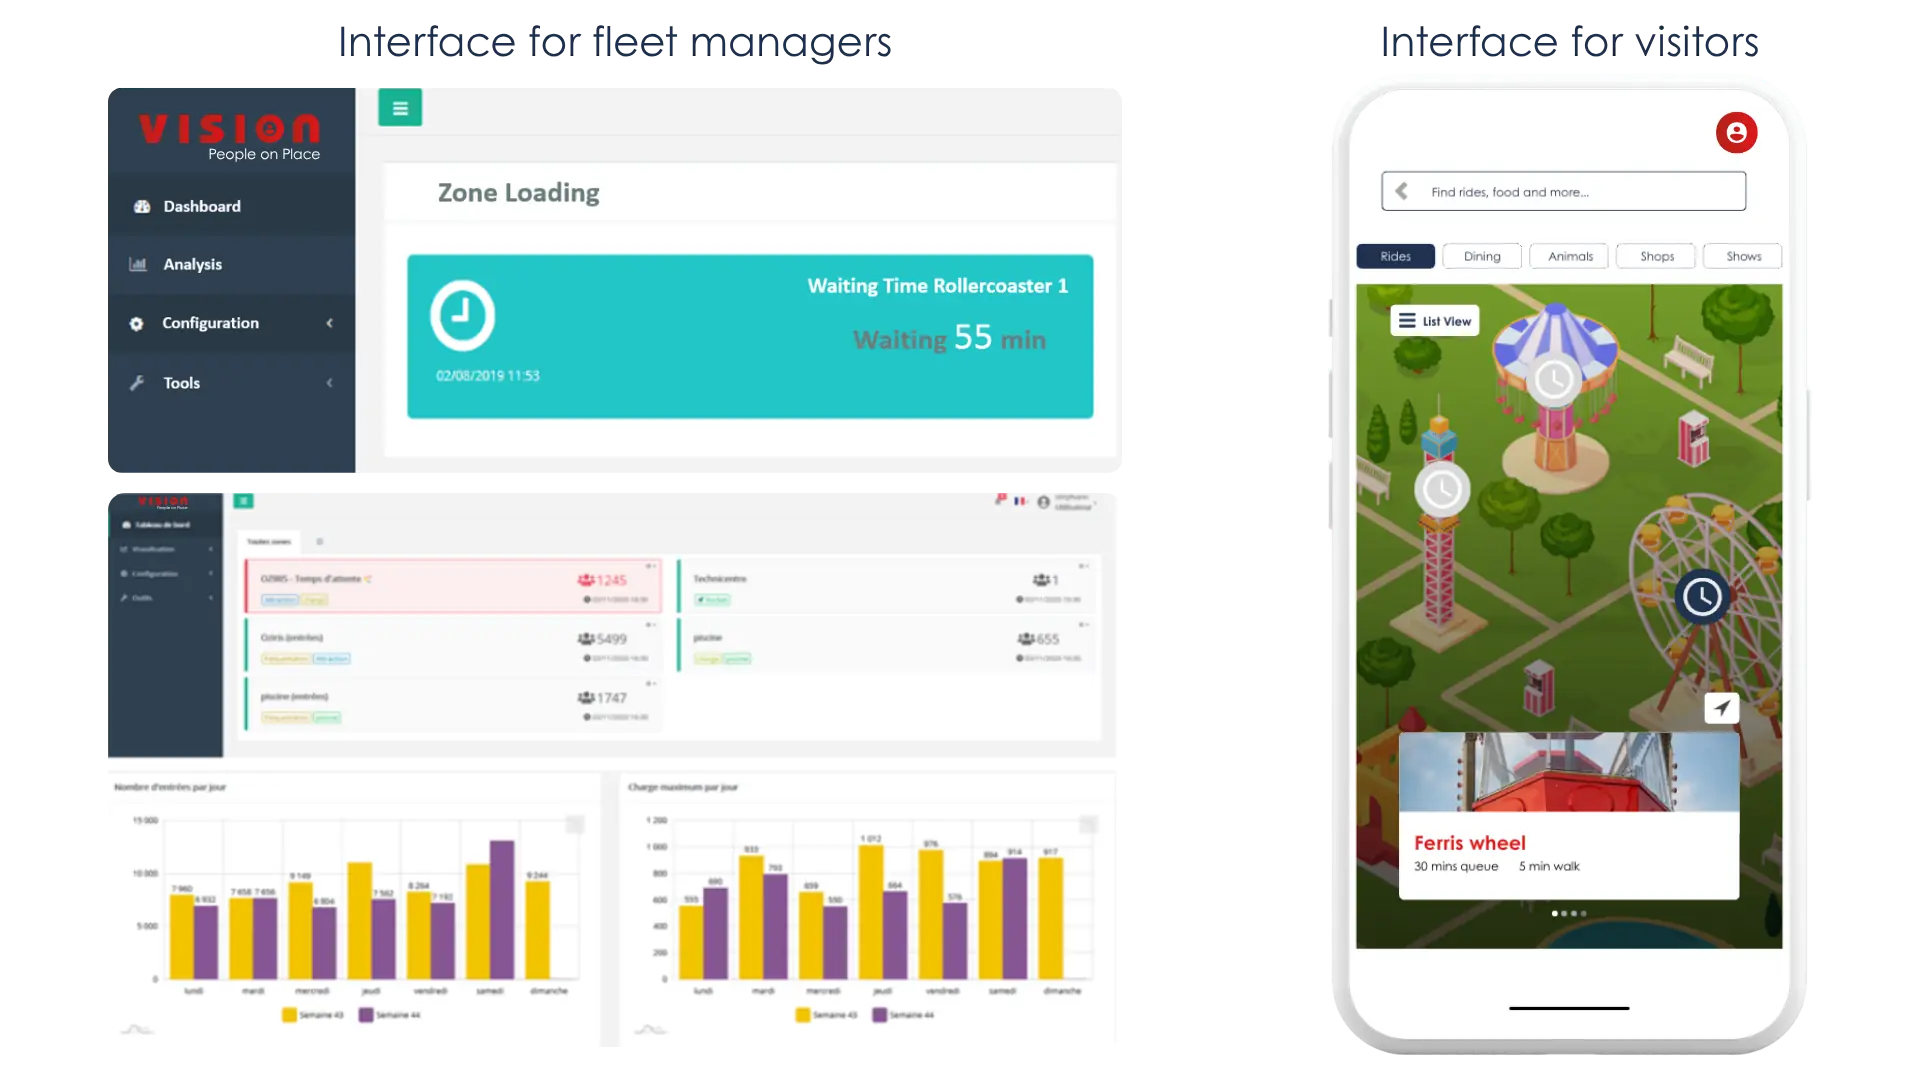
All data from the sensor network feeds into Acorel's centralised software platform, VISION Pop. This gives park operators a single unified view of queue status across all attractions simultaneously. Two key indicators structure operational decision-making: the number of visitors currently in each queue, and both actual and predicted waiting times. Together, these allow operators to accurately identify peak periods, adjust resource deployment dynamically, and optimise throughput at each attraction.
3D stereoscopic sensors: Continuously detect entries, exits, and queue lengths with high accuracy at every attraction.
Computer Vision: Analyses movement patterns within queues, tracking flow trends throughout the day.
Vision Pop platform: Centralised software dashboard giving operators a unified real-time view of all queues.
API distribution layer: Transmits live data to third-party systems / mobile apps, kiosks, park websites, and digital displays.
A connected visitor-facing ecosystem
The solution extends beyond back-of-house operations. Via an open API, waiting time data is distributed to every visitor-facing touchpoint: displayed at attraction entrances, integrated into the park's mobile application, shown on interactive maps and on-site kiosks, and made available on the park's website. This keeps visitors informed throughout their visit, enabling them to make better decisions about which attractions to head to and when.
From reactive to dynamic management
The shift enabled by this system is fundamental: park management moves from intuition-based decision-making to dynamic, data-driven control. Operators can respond to actual demand as it unfolds, not after the fact. Beyond day-to-day operations, the data collected over time supports ongoing performance analysis enabling the park to assess the impact of operational changes, refine staffing models, and continuously improve fleet performance.
Outcomes
Benefits
Reduced perceived wait times
Real-time queue visibility
Accurate wait predictions
Improved resource management
Enhanced visitor experience
Optimised park operations
Operational performance
With reliable, continuous data on queue lengths and visitor flows, park operators gain the ability to identify peak periods accurately and deploy resources precisely where they are needed. Attraction throughput can be optimised based on real demand rather than estimates, reducing unnecessary bottlenecks and improving overall park capacity management.
Visitor satisfaction
Reducing perceived waiting time is one of the most impactful levers in visitor satisfaction at amusement parks. By giving visitors transparent, accurate information about how long they can expect to wait before they join a queue the solution reduces frustration and allows guests to plan their day more effectively. The result is a more enjoyable, less stressful park experience.
Continuous improvement
The data collected forms a growing operational asset. Rather than relying on seasonal debriefs or post-hoc reviews, park management teams can assess the measurable impact of every operational decision whether adjusting staffing levels, modifying ride throughput, or redistributing visitor flows during peak periods. Decisions become grounded in concrete, measurable indicators rather than intuition.
| Dimension | Before | With Acorel |
|---|---|---|
| Queue measurement | Manual estimates, periodic checks | Continuous, automated, real-time |
| Decision basis | Staff experience & intuition | Live data & predictive indicators |
| Visitor information | Static or absent | Live on apps, kiosks & displays |
| Resource allocation | Reactive, post-congestion | Proactive, demand-aligned |
| Performance analysis | Limited retrospective data | Ongoing, measurable, comparable |